In the second part of this post I need to document way for testing how fast disk IO is doing and how fast network infrastructure between 2 nodes when using standard TCP, all tests assume Linux based infrastructure.
Disk IO:
There are multiple ways to measure disk IO performance and to measure how fast we can read and write to disk.
To report on how many read and write operations are being executed, we use the tool iostat.
iostat with the -d option will report information about disk IO utilization, in terms of amount of transfers per second and bytes of reads and writes operations per filesystem.
More information can be displayed with extended statistics option -x:

One way to list the filesystems connected to your system is to use the proc filesystem as below:
[root@feanor ~]# cat /proc/partitions
major minor #blocks name
8 0 94753088 sda
8 1 1048576 sda1
8 2 93703168 sda2
11 0 58360 sr0
253 0 52428800 dm-0
253 1 4063232 dm-1
253 2 37203968 dm-2
[root@feanor ~]#
Knowing filesystem / device information is useful when using the iostat command.
Another way is to use the lsblk command:
[root@feanor ~]# lsblk
NAME MAJ:MIN RM SIZE RO TYPE MOUNTPOINT
sda 8:0 0 90.4G 0 disk
├─sda1 8:1 0 1G 0 part /boot
└─sda2 8:2 0 89.4G 0 part
├─centos-root 253:0 0 50G 0 lvm /
├─centos-swap 253:1 0 3.9G 0 lvm [SWAP]
└─centos-home 253:2 0 35.5G 0 lvm /home
sr0 11:0 1 57M 0 rom
[root@feanor ~]#
One other way to monitor the IO speed on the system is to use the iotop command, iotop would show interactive information on which process is using disk reads and writes and the percentage of time used to do swap in operation and IO waiting.

To focus on the disk IO speed on a given disk or filesystem, we have multiple commands to help measure how fast we can read and write.
Using hdparm, we can measure how fast we can read from a disk using the -t and -T options to use check cached reads and direct device reads:
[root@feanor man]# hdparm -tT /dev/sda
/dev/sda:
Timing cached reads: 23670 MB in 1.99 seconds = 11893.43 MB/sec
Timing buffered disk reads: 1866 MB in 3.00 seconds = 621.44 MB/sec
[root@feanor man]#
Another way is to use the ioping command, this command would try to measure the disk latency and could print raw statistics:
[root@feanor man]# ioping /dev/sda1
4 KiB <<< /dev/sda1 (block device 1 GiB): request=1 time=45.8 ms (warmup)
4 KiB <<< /dev/sda1 (block device 1 GiB): request=2 time=46.8 ms
4 KiB <<< /dev/sda1 (block device 1 GiB): request=3 time=810.5 us
4 KiB <<< /dev/sda1 (block device 1 GiB): request=4 time=948.4 us
4 KiB <<< /dev/sda1 (block device 1 GiB): request=5 time=780.7 us
4 KiB <<< /dev/sda1 (block device 1 GiB): request=6 time=713.7 us
4 KiB <<< /dev/sda1 (block device 1 GiB): request=7 time=47.6 ms (slow)
^C
--- /dev/sda1 (block device 1 GiB) ioping statistics ---
6 requests completed in 97.6 ms, 24 KiB read, 61 iops, 245.8 KiB/s
generated 7 requests in 6.08 s, 28 KiB, 1 iops, 4.60 KiB/s
min/avg/max/mdev = 713.7 us / 16.3 ms / 47.6 ms / 21.9 ms
[root@feanor man]#
One other poor man's way to test the disk performance is to use the Linux dd command.
dd will print the average bytes per second speed it saw while executing the request.
You might want to execute multiple times to get a more useful average:
The below is a write test:
[root@feanor ~]# dd if=/dev/zero of=./tempfile bs=10K count=409600 status=progress conv=fdatasync
3872133120 bytes (3.9 GB) copied, 6.004911 s, 645 MB/s
409600+0 records in
409600+0 records out
4194304000 bytes (4.2 GB) copied, 8.79669 s, 477 MB/s
[root@feanor ~]# dd if=/dev/zero of=./tempfile bs=10K count=409600 status=progress conv=fdatasync
3910645760 bytes (3.9 GB) copied, 7.023097 s, 557 MB/s
409600+0 records in
409600+0 records out
4194304000 bytes (4.2 GB) copied, 9.18262 s, 457 MB/s
[root@feanor ~]#
and this one is a read test:
[root@feanor ~]# dd if=./tempfile of=/dev/null bs=10K count=409600 status=progress
4128276480 bytes (4.1 GB) copied, 3.000355 s, 1.4 GB/s
409600+0 records in
409600+0 records out
4194304000 bytes (4.2 GB) copied, 3.0407 s, 1.4 GB/s
[root@feanor ~]# dd if=./tempfile of=/dev/null bs=10K count=409600 status=progress
3743528960 bytes (3.7 GB) copied, 3.002333 s, 1.2 GB/s
409600+0 records in
409600+0 records out
4194304000 bytes (4.2 GB) copied, 3.307 s, 1.3 GB/s
[root@feanor ~]#
The above tests were affected by Linux disk caching, if we disable the cache, we can get results for the true disk performance:
[root@feanor ~]# echo 3 > /proc/sys/vm/drop_caches
[root@feanor ~]# dd if=./tempfile of=/dev/null bs=10K count=409600 status=progress
3573360640 bytes (3.6 GB) copied, 3.003885 s, 1.2 GB/s
409600+0 records in
409600+0 records out
4194304000 bytes (4.2 GB) copied, 3.47044 s, 1.2 GB/s
[root@feanor ~]# dd if=./tempfile of=/dev/null bs=10K count=409600 status=progress
3053260800 bytes (3.1 GB) copied, 3.004402 s, 1.0 GB/s
409600+0 records in
409600+0 records out
4194304000 bytes (4.2 GB) copied, 3.95025 s, 1.1 GB/s
[root@feanor ~]# dd if=./tempfile of=/dev/null bs=10K count=409600 status=progress
3589294080 bytes (3.6 GB) copied, 3.000806 s, 1.2 GB/s
409600+0 records in
409600+0 records out
4194304000 bytes (4.2 GB) copied, 3.46599 s, 1.2 GB/s
[root@feanor ~]#
In my case it didn't seem to make a lot of difference if we drop the kernel disk caches.
One last test would be to use he bonnie++ package.
First we need to install it:
[root@feanor ~]# yum search bonnie
Loaded plugins: fastestmirror, langpacks
Loading mirror speeds from cached hostfile
* epel: mirror.i3d.net
==================================================================================== N/S matched: bonnie =====================================================================================
bonnie++.x86_64 : Filesystem and disk benchmark & burn-in suite
Name and summary matches only, use "search all" for everything.
[root@feanor ~]# yum install bonnie++.x86_64
One bonnie++ is installed, we then run the test using a none root user and then we check the output:
[sherif@feanor ~]$ bonnie++ -f -n 0 |tee bonnie.out
Writing intelligently...done
Rewriting...done
Reading intelligently...done
start 'em...done...done...done...done...done...
Version 1.97 ------Sequential Output------ --Sequential Input- --Random-
Concurrency 1 -Per Chr- --Block-- -Rewrite- -Per Chr- --Block-- --Seeks--
Machine Size K/sec %CP K/sec %CP K/sec %CP K/sec %CP K/sec %CP /sec %CP
feanor 8G 864053 70 513975 69 1430897 86 7303 271
Latency 469ms 549ms 500ms 47897us
1.97,1.97,feanor,1,1590328006,8G,,,,864053,70,513975,69,,,1430897,86,7303,271,,,,,,,,,,,,,,,,,,,469ms,549ms,,500ms,47897us,,,,,,
[sherif@feanor ~]$
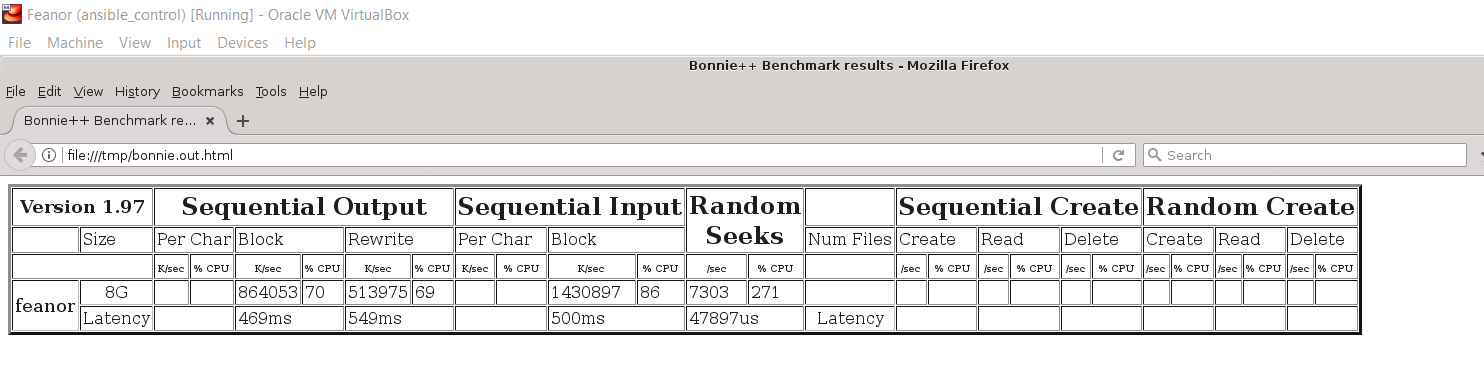
The text output is not the pretties, thus bonnie++ comes with a nice tool to convert the output to html:
[sherif@feanor ~]$ cat bonnie.out |bon_csv2html >/tmp/bonnie.out.html 2>/dev/null
[sherif@feanor sherif]# firefox /tmp/bonnie.out.html
The HTML report looks more readable:
Network:
To test network throughput and latency, we have a couple of tools to use.
For testing throughput, we can use the iperf tool.
To do the test, iperf needs to be installed on the 2 nodes involved in the test and should be running as a server on 1 of the node and a client on the other.
To run iperf as server we use the -s option:
sherif@fingon:~$ iperf -s
------------------------------------------------------------
Server listening on TCP port 5001
TCP window size: 128 KByte (default)
------------------------------------------------------------
Then on the other node we run iperf as a client with the -c option, we need to provide the name of the server to connect to and optionally provide number of bytes used in the test with the -n option:
[root@feanor ~]# iperf -n 10240000 -c fingon
------------------------------------------------------------
Client connecting to fingon, TCP port 5001
TCP window size: 280 KByte (default)
------------------------------------------------------------
[ 3] local 192.168.56.104 port 48608 connected with 192.168.56.106 port 5001
[ ID] Interval Transfer Bandwidth
[ 3] 0.0- 0.1 sec 9.77 MBytes 1.25 Gbits/sec
[root@feanor ~]#
Another way to test network through put is using the tool nuttcp, it is very similar to iperf and also works in client server model:
On server side we use the -S option:
[root@feanor ~]# nuttcp -S --nofork
Then on the client side, we run nuttcp with the server hostname or ip address:
sherif@fingon:~$ nuttcp -i1 feanor
166.2500 MB / 1.00 sec = 1394.2422 Mbps 0 retrans
204.1250 MB / 1.00 sec = 1712.4804 Mbps 0 retrans
215.9375 MB / 1.00 sec = 1811.5092 Mbps 0 retrans
190.5000 MB / 1.00 sec = 1597.7822 Mbps 0 retrans
91.1875 MB / 1.00 sec = 764.9232 Mbps 0 retrans
180.5625 MB / 1.00 sec = 1514.8680 Mbps 0 retrans
209.0625 MB / 1.00 sec = 1753.7416 Mbps 0 retrans
204.3750 MB / 1.00 sec = 1713.3612 Mbps 0 retrans
206.1250 MB / 1.00 sec = 1730.2680 Mbps 0 retrans
176.6875 MB / 1.00 sec = 1481.2068 Mbps 0 retrans
1844.8750 MB / 10.43 sec = 1483.6188 Mbps 11 %TX 43 %RX 0 retrans 1.10 msRTT
sherif@fingon:~$
For testing network latency, we use old fashioned ping, ping reports the latency time statistics at the end of its run:
[root@feanor ~]# ping fingon
PING fingon (192.168.56.106) 56(84) bytes of data.
64 bytes from fingon (192.168.56.106): icmp_seq=1 ttl=64 time=0.628 ms
64 bytes from fingon (192.168.56.106): icmp_seq=2 ttl=64 time=1.26 ms
64 bytes from fingon (192.168.56.106): icmp_seq=3 ttl=64 time=1.39 ms
64 bytes from fingon (192.168.56.106): icmp_seq=4 ttl=64 time=1.02 ms
64 bytes from fingon (192.168.56.106): icmp_seq=5 ttl=64 time=1.12 ms
64 bytes from fingon (192.168.56.106): icmp_seq=6 ttl=64 time=1.16 ms
64 bytes from fingon (192.168.56.106): icmp_seq=7 ttl=64 time=1.15 ms
64 bytes from fingon (192.168.56.106): icmp_seq=8 ttl=64 time=1.21 ms
^C
--- fingon ping statistics ---
8 packets transmitted, 8 received, 0% packet loss, time 7029ms
rtt min/avg/max/mdev = 0.628/1.120/1.393/0.215 ms
[root@feanor ~]#
Using sar:
last part of this post is dedicated the the good old sar system reporting tool.
sar offers a comprehensive set of reported statistics about the system CPU, memory and IO operations.
sar reports the data collected in various points in time and can provide very useful information about patterns of usage for system resources.
Below are a couple of examples:
[root@feanor ~]# sar -n DEV
Linux 3.10.0-862.el7.x86_64 (feanor) 05/24/2020 _x86_64_ (4 CPU)
08:15:02 AM LINUX RESTART
08:20:02 AM IFACE rxpck/s txpck/s rxkB/s txkB/s rxcmp/s txcmp/s rxmcst/s
08:30:01 AM enp0s3 0.08 0.09 0.01 0.01 0.00 0.00 0.00
08:30:01 AM enp0s8 0.00 0.00 0.00 0.00 0.00 0.00 0.00
08:30:01 AM enp0s9 0.01 0.01 0.00 0.00 0.00 0.00 0.00
08:30:01 AM lo 0.00 0.00 0.00 0.00 0.00 0.00 0.00
08:30:01 AM virbr0-nic 0.00 0.00 0.00 0.00 0.00 0.00 0.00
08:30:01 AM virbr0 0.00 0.00 0.00 0.00 0.00 0.00 0.00
08:40:02 AM enp0s3 0.06 0.06 0.00 0.01 0.00 0.00 0.00
08:40:02 AM enp0s8 0.00 0.00 0.00 0.00 0.00 0.00 0.00
08:40:02 AM enp0s9 0.13 0.01 0.01 0.00 0.00 0.00 0.07
08:40:02 AM lo 0.00 0.00 0.00 0.00 0.00 0.00 0.00
08:40:02 AM virbr0-nic 0.00 0.00 0.00 0.00 0.00 0.00 0.00
08:40:02 AM virbr0 0.00 0.00 0.00 0.00 0.00 0.00 0.00
08:50:01 AM enp0s3 0.04 0.04 0.00 0.00 0.00 0.00 0.00
08:50:01 AM enp0s8 0.00 0.00 0.00 0.00 0.00 0.00 0.00
08:50:01 AM enp0s9 0.02 0.01 0.00 0.00 0.00 0.00 0.01
08:50:01 AM lo 0.00 0.00 0.00 0.00 0.00 0.00 0.00
08:50:01 AM virbr0-nic 0.00 0.00 0.00 0.00 0.00 0.00 0.00
08:50:01 AM virbr0 0.00 0.00 0.00 0.00 0.00 0.00 0.00
09:00:01 AM enp0s3 0.02 0.03 0.00 0.00 0.00 0.00 0.00
09:00:01 AM enp0s8 0.00 0.00 0.00 0.00 0.00 0.00 0.00
09:00:01 AM enp0s9 0.01 0.01 0.00 0.00 0.00 0.00 0.00
09:00:01 AM lo 0.00 0.00 0.00 0.00 0.00 0.00 0.00
09:00:01 AM virbr0-nic 0.00 0.00 0.00 0.00 0.00 0.00 0.00
09:00:01 AM virbr0 0.00 0.00 0.00 0.00 0.00 0.00 0.00
09:10:01 AM enp0s3 0.02 0.02 0.00 0.00 0.00 0.00 0.00
09:10:01 AM enp0s8 0.00 0.00 0.00 0.00 0.00 0.00 0.00
09:10:01 AM enp0s9 0.04 0.01 0.01 0.00 0.00 0.00 0.01
09:10:01 AM lo 0.00 0.00 0.00 0.00 0.00 0.00 0.00
09:10:01 AM virbr0-nic 0.00 0.00 0.00 0.00 0.00 0.00 0.00
09:10:01 AM virbr0 0.00 0.00 0.00 0.00 0.00 0.00 0.00
09:20:01 AM enp0s3 10.32 1.67 14.53 0.11 0.00 0.00 0.00
09:20:01 AM enp0s8 0.00 0.00 0.00 0.00 0.00 0.00 0.00
09:20:01 AM enp0s9 0.01 0.01 0.00 0.00 0.00 0.00 0.01
.....
05:40:01 PM virbr0 0.00 0.00 0.00 0.00 0.00 0.00 0.00
Average: enp0s3 0.12 0.12 0.03 0.01 0.00 0.00 0.00
Average: enp0s8 0.00 0.00 0.00 0.00 0.00 0.00 0.00
Average: enp0s9 451.53 225.65 658.82 589.50 0.00 0.00 0.01
Average: lo 0.00 0.00 0.00 0.00 0.00 0.00 0.00
Average: virbr0-nic 0.00 0.00 0.00 0.00 0.00 0.00 0.00
Average: virbr0 0.00 0.00 0.00 0.00 0.00 0.00 0.00
[root@feanor ~]# sar -u
Linux 3.10.0-862.el7.x86_64 (feanor) 05/24/2020 _x86_64_ (4 CPU)
08:15:02 AM LINUX RESTART
08:20:02 AM CPU %user %nice %system %iowait %steal %idle
08:30:01 AM all 0.29 0.00 0.27 0.05 0.00 99.39
08:40:02 AM all 0.09 0.00 0.11 0.02 0.00 99.78
08:50:01 AM all 1.51 0.00 0.51 0.05 0.00 97.93
09:00:01 AM all 1.67 0.00 1.29 0.75 0.00 96.29
09:10:01 AM all 1.13 0.00 0.43 0.05 0.00 98.39
09:20:01 AM all 0.40 0.00 0.60 0.19 0.00 98.81
09:30:01 AM all 0.21 0.00 0.20 0.05 0.00 99.53
09:40:01 AM all 0.39 0.00 1.60 0.17 0.00 97.85
Average: all 0.71 0.00 0.62 0.17 0.00 98.50
09:44:57 AM LINUX RESTART
For a complete set of data, one could use the sar -A command which will log a huge amount of information about the server in the current day.
References & good reads:
https://linuxhint.com/disk_activity_web_server/
https://wiki.archlinux.org/index.php/Benchmarking
https://www.cyberciti.biz/faq/howto-linux-unix-test-disk-performance-with-dd-command/
https://www.opsdash.com/blog/disk-monitoring-linux.html
https://haydenjames.io/linux-server-performance-disk-io-slowing-application/
https://www.unixmen.com/how-to-measure-disk-performance-with-fio-and-ioping/
https://fio.readthedocs.io/en/latest/index.html
https://dotlayer.com/how-to-use-fio-to-measure-disk-performance-in-linux/
https://linux-mm.org/Drop_Caches
https://books.google.nl/books?id=1nc5DwAAQBAJ&printsec=frontcover&hl=nl&source=gbs_ge_summary_r&cad=0#v=onepage&q=bonnie&f=false
https://www.cyberciti.biz/faq/ping-test-a-specific-port-of-machine-ip-address-using-linux-unix/
https://linoxide.com/monitoring-2/10-tools-monitor-cpu-performance-usage-linux-command-line/
Found a another good collection of tools to monitor network traffic in real time.
ReplyDeletefirst is nload:
https://www.tecmint.com/nload-monitor-linux-network-traffic-bandwidth-usage/
iftop:
https://www.tecmint.com/iftop-linux-network-bandwidth-monitoring-tool/
speedmeter:
http://excess.org/speedometer/
More tools can be found here: https://itsfoss.com/network-speed-monitor-linux/